Calculation Principle of Process Capability Index: Cp and Cpk
2023-08-11
Process capability, also known as process capability indices, refers to the ability of processing to meet the processing quality. It is a measure of the inherent consistency of processing and the minimum fluctuation at the most steady state.
Overview of process capabilities
Process capability, also known as process capability indicees, refers to the ability of the process to meet the processing quality. It is a measure of the inherent consistency of process and the minimum fluctuation at the most steady state. When the process is in a steady state, 99.73% of the quality characteristic values of the product are scattered in the interval [µ-3ω, µ+3ω], (where µ is the overall mean of the product characteristic value, σ is the overall standard deviation of the product characteristic value) That is, almost all product characteristic values fall within the range of 6 σ; Therefore, 6 σ is usually used to represent the processability, and the smaller its value, the better.
Definition and calculation of Process Capability Index Cp
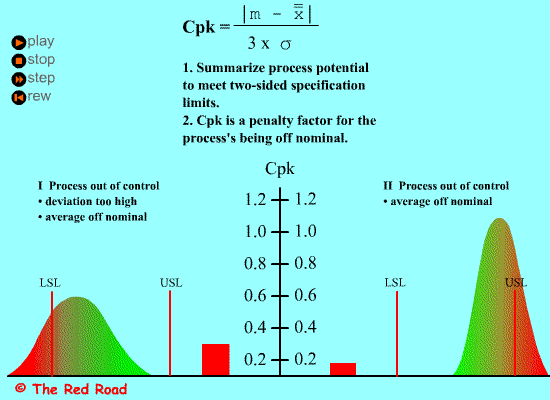
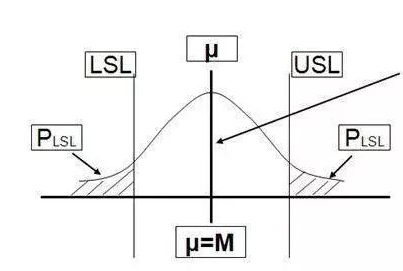
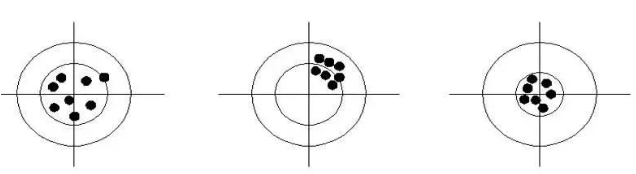
The process capability index Cp characterizes the inherent fluctuation state of the process, that is, the level of technology.It is the case where the average value µ of the process coincides with the target value M, as shown in the figure below:
When the process is under statistical control, the process capability index Cp can be expressed by the following formula:
Cp = (USL-LSL)/6σ
The specification center is M=(USL+LSL)/2, so the smaller σ, the greater the process capacity index, indicating that the higher the processing quality, but at this time the requirements for equipment and operators are also high, the greater the processing cost, so the choice of Cp value should be based on the comprehensive analysis of technology and economy to decide. Generally, the process capability index Cp≧1 is required, but according to the 6Sigma process capability requirement Cp22, that is, the process capability index CpCp2 in the short term.
Example:
The specification of a lathe machining shaft is 50±0.01mm, and σ=0.0025 is measured within a certain period of time to obtain the process capability index of lathe machining.
Cp = (USL-LSL)/6σ
=0.02/ (6*0.0025)
=1.33
Definition and calculation of Process capability Index Cpk
Above we discussed Cp, that is, the situation where the average value of the process output coincides with the target value. In fact, the situation where the target value coincides with the average value is relatively rare; therefore, an overview of the offset K is introduced, that is, the deviation process between the average value of the process µ and the target value M, as shown in the figure below:
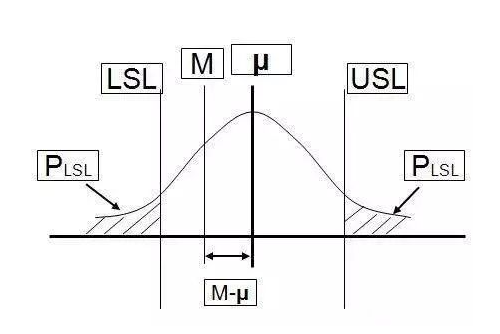
K =|M-µ|/(T/2) =2|M-µ|/T (where T=USL-LSL)
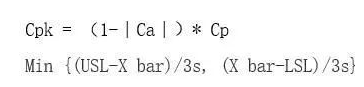
Cpk = (1-K)*Cp= (1-2|M-μ|/T)*T/6σ
= T/6σ-|M-μ|/3σ
It can be seen from the formula:
Cpk=Cp-|M-µ|/3σ,
that is,
Cp-Cpk=|M-µ|/3σ, try to make Cp=Cpk,|M-µ|/3σ
is our opportunity for improvement.
Example:
The specification of a lathe machining shaft is 50±0.01mm, and the average value µ=49.995 and σ=0.0025 are measured within a certain period of time, and the process capacity index of lathe machining is obtained.
Cpk =T/6σ- |M-μ|/3σ
=0.02/ (6*0.0025)-|50-49.995|/ (3*0.0025)
=1.33-0.667
=0.676
Definition of PPK and CPK, difference analysis and calculation
- PP (Performance Index of Process) does not consider whether the process is offset or not, and the tolerance range is divided by the process performance.
- Cpk (Preliminary process Capability) considers the process performance of sample data when the process is biased.
* ppk is usually used to compare with cp and Cpk to measure and confirm the priority of internal improvements.
Applications and How to Use Them?
ppk: Process performance index, which represents the performance of the process over a period of time
- The output meets the specifications + prediction graphics + long-term unstable process (process stability is not required)
- Process performance evaluation for small batch production (trial production), Ppk>1.67 is required;
- Used for real-time process performance research and initial process capability evaluation.
Cpk: Process ability index, which represents the ability of the process itself, an index in an ideal state.
- Process stability + sufficient historical data/initial data (more than 100 individual data & 25 subgroups)
- For the evaluation of the production capacity after mass production, Cpk>1.33 is required
- It is mainly used for periodic process evaluation.
Annotation:
- Sometimes CPK needs to be controlled by the control boundary of PPK
- PPK represents the variance between all data; CPK removes the intra-group variance (the mean within the group) and only considers the sub-group variance.
- The difference between PPK and CPK is like the difference between a person’s work performance and workability.
- Before calculating the Cpk, be sure to check whether the process is stable. Generally, it is required to have 100 data and 25 mean values. Sampling method: Select the time at a fixed interval of subsamples (for example: take 4 samples continuously every 1 hour to calculate the mean. Use the xbar-R diagram to check whether the process is stable. If it is stable, the calculated Cpk is.
- PPK does not require the inspection process to be stable. Sampling method: No need for 1 hour interval, 100 data are continuously taken. Because PPK did not check whether the process is stable (risk), the target PPK is required to be >1.67. Because there may be special reasons in PPK, the deterioration cannot be called the process capability index, but the process performance index.
- If the process is unstable, the special cause needs to be identified and re-evaluated after elimination (the process is cumbersome). For initial data shortage cases, PPK can be used after the customer agrees.
- When the process is stable + CPK meets the requirements, use the control chart to monitor the process. There may be special reasons for the actual operation of the process, and once it is discovered, it must be identified and eliminated to return the process to stability.
- When the process is running for a long period of time, check CPK>1.33 regularly. Usually, long-term CPK<short-term CPK, which is due to the increase in the standard deviation value in the calculated data.
The Calculation of Cpk
CPK calculation premise: variation (or fluctuation), because of the existence of variation, the size of the ability is distinguished.
Types of variation:
- Variation of ordinary causes: it usually exists objectively, and it has a certain impact on the process but it is not obvious.
- Variation for special reasons: it occurs occasionally and has a great impact on the process.
For example: The air-conditioned room has a temperature of 25 degrees. Due to the temperature difference between indoor and outdoor, there will be energy exchange at all times, so the indoor temperature may actually change within a certain range (small) (24.99, 24.98, 25.00, 25.0..When it is affected by ordinary factors, and someone pushes the door in, the indoor temperature instantly changes greatly. At this time, it is affected by both ordinary factors and special factors. Sometimes cpk can also be used in the processing and packaging industry, you can click here to find out how process capability indices help mangement and leadership to improve their business.
Process performance:
If it is only affected by ordinary factors, the process on the control chart is controlled, and if it is affected by special reasons, there will be anomalies on the control chart.
Prerequisites for the use of CP/CPK: Process stability + normal distribution + more than 25 sets of data, only considering that the process is affected by ordinary factors.
*It is recommended to have at least 20 groups (the fewer data groups, the greater the risk of accepting the results)
Calculation formula of Cpk
1. The calculation formula of PP and PPK is the same as that of CP and CPK.
2. Difference: The calculation method of the variation (standard deviation) σ is different.
PPK time,.It is calculated as the standard deviation formula; at cpk, σ-R/d2 degree difference = subgroup extreme difference mean/variation constant] The variation of PPK includes two kinds of variation caused by ordinary factors and special factors, which is greater than the CPK variation for the same project.Therefore, in theory CPK=PPK, but in actual use of minitab, PPK is slightly larger than CPK, because the variation of CPK is estimated and there is an error.(Does not affect the evaluation of the final process capacity)
3. The process is only affected by the deterioration of ordinary factors. It is an ideal state. The process will always be affected by various special factors. Therefore, it can be called CP/CPK (short-term process capability/potential process capability) and PP/PPK long-term process capability/performance index respectively.
4. Because PP/PPK does not require process stability (the influence of ordinary and special factors has been considered in the calculation formula), PPAP requires PPK to be used to measure process capabilities when the trial production process is unstable.
Only PPK>1.67 can enter the mass production stage, so PPK is also known as the production capacity index.
5. After entering mass production, the difference between the three indexes of CP/CPK/PPK should be monitored at the same time to determine whether there are problems, management problems or technical problems in the process.
To give an example:
a. When CP> 1.33, it indicates that the process deterioration is relatively small (USL-LSL is the specification determination value). At this time, CPK is detected at the same time. If CP and CPK are very different, it means that the process deterioration is large and needs to be centered.
Compare CPK and PPK again. If the difference between the two is not large, the process is less affected by special factors, and vice versa, it is greatly affected.
b. The influence of special factors is often easier to find, but if the CP itself is small, it means that the process is greatly affected by the deterioration of ordinary factors. If you want to improve the process capabilities, you need more investment and higher decision-making to solve the problem.
Therefore, even if the cpk value is high (for example, greater than 2), if it is different from CP/CPK, the process needs to be improved.
c. If CPK is higher than PPK, then: 1 The process is not controlled 2 There are anomalies on the control chart 3.The calculator misused the conclusion.
The difference between PPK and CPK:
1. The calculation formula of δ is different. PPK uses the standard deviation and CPK uses the empirical formula (the deviation is very small).
2. Different sampling methods: PPK needs to be continuously produced in a short period of time, and CPK generally takes one set of data per day (usually 5).
Premium Listing
ÉLITER Packaging Machinery
Next-generation Packaging Machines


Featured Suppliers


Notice: Nicholl Food Packaging has been sold to Euro Packaging Group
Nicholl Food Packaging Ltd
Walkmill Lane
Cannock
Staffordshire WS11 0XA
ABOUT US
Information site on food packaging and processing news.
Our topics cover innovations, updates, news around food packaging, food packaging automation, packaging and processing.